Where the wine isn't
Land fit for vineyards lies idle across Turkey, Ukraine, southern Russia and Iran. A world that drinks less wine every year is a hard place to plant it
And much as Wine has play'd the Infidel,
Omar Khayyam, in Edward FitzGerald's version of the Rubaiyat (1889)
And robb'd me of my Robe of Honor—Well,
I wonder often what the Vintners buy
One half so precious as the stuff they sell.
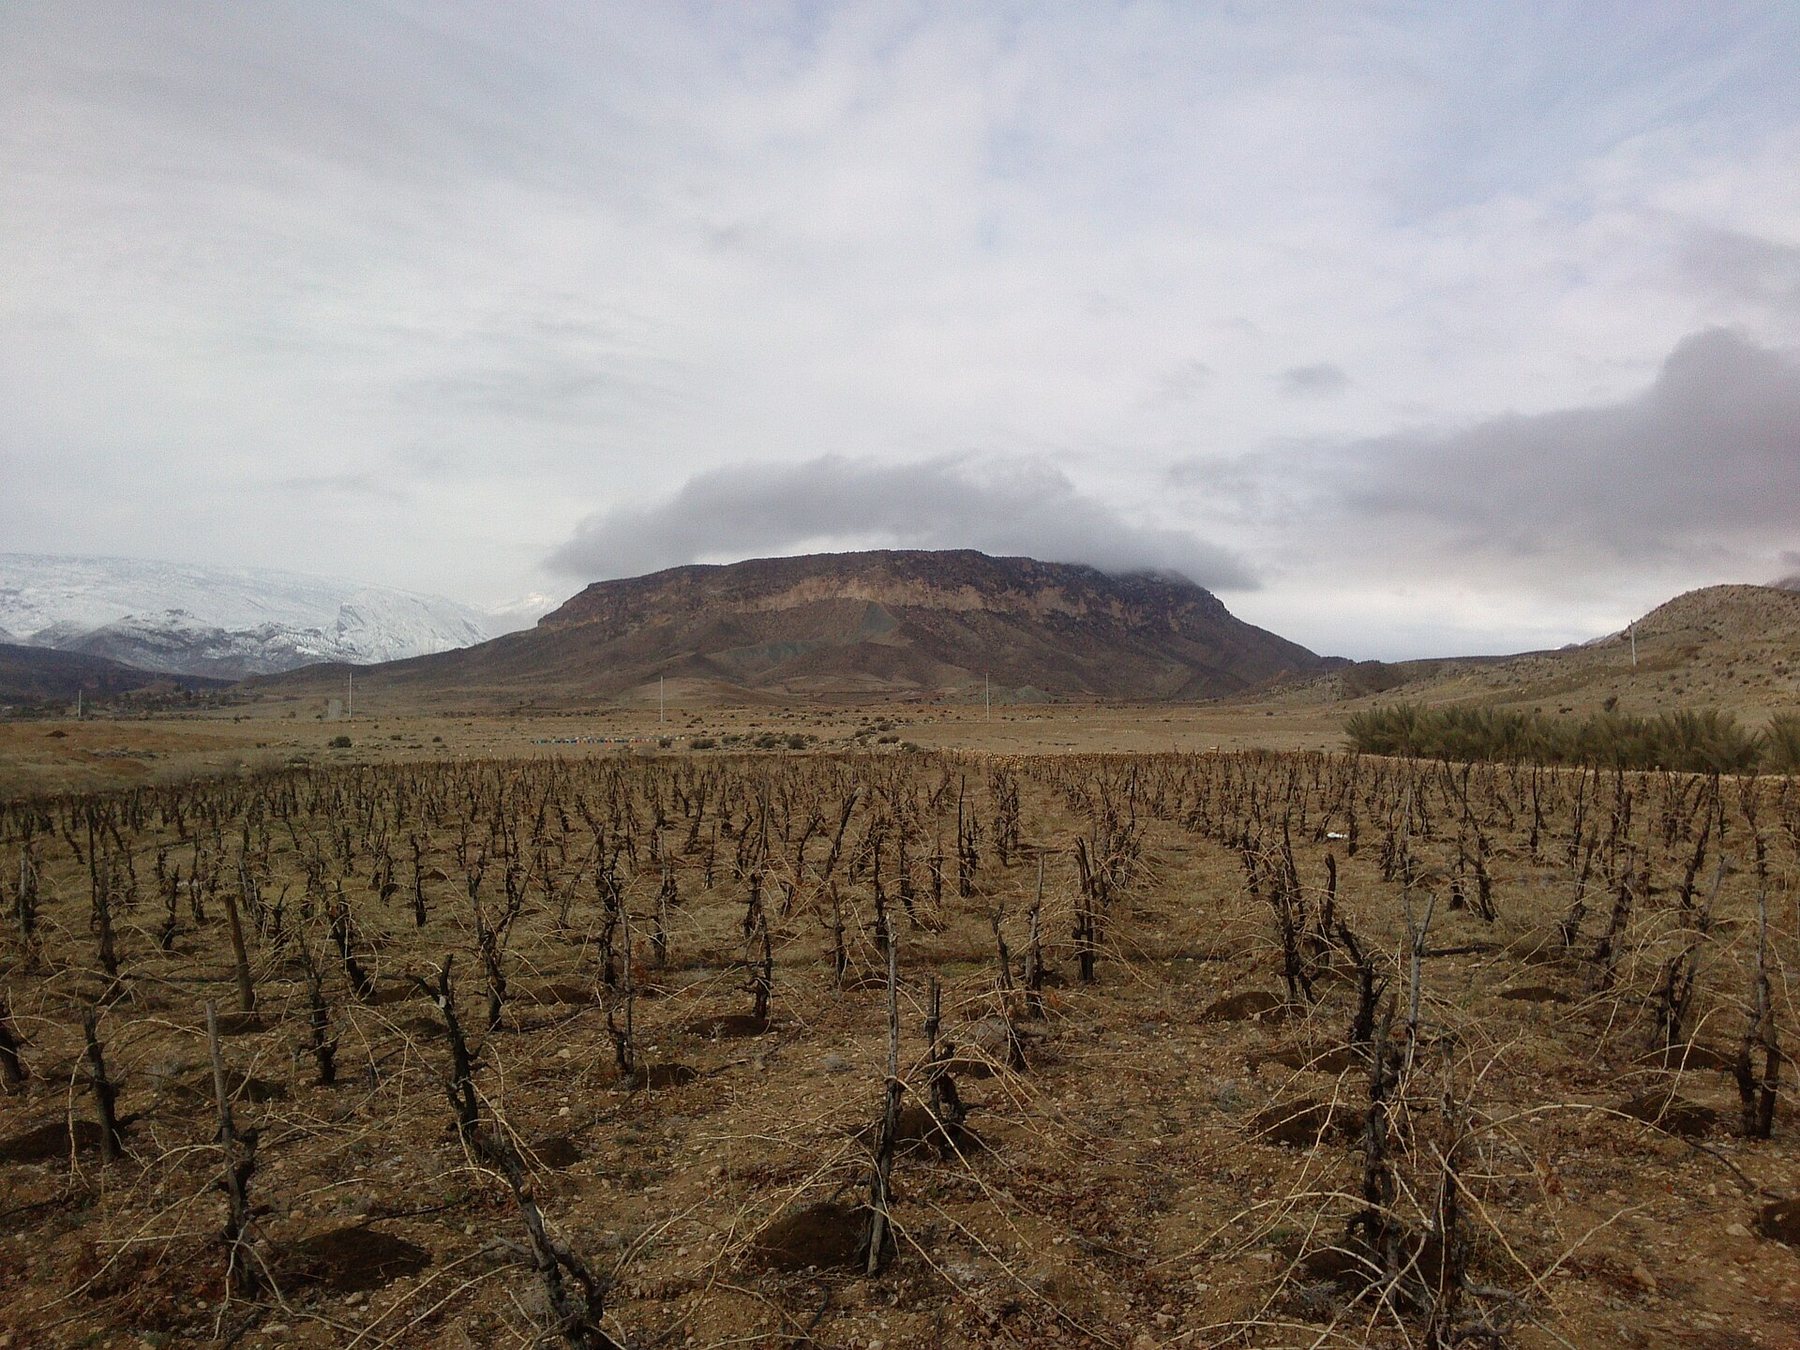
Omar Khayyam, the mathematician and astronomer of Nishapur, is remembered in the West for quatrains in praise of wine, though scholars doubt that he wrote many of the verses that bear his name. Nishapur lies in Khorasan, in north-eastern Iran. By our reckoning Khorasan has more farmland suited to vines than any other Iranian province. Since 1979 Iran has banned alcohol for Muslims, and almost none of that land grows grapes for wine.
Where wine is made owes as much to history as to geography. Monks, merchants, colonists and migrants decided where vines went, and laws and religions decided where they could not. So a simple question has no easy answer: if wine were grown wherever the land suits it, where would it be grown?
To find out, we divided the world's land into squares about 9km across and recorded each one's climate, water and soil. We then showed a computer model the vineyards of 29 countries that grow grapes mainly for wine, as drawn by volunteers on OpenStreetMap, an open map of the world, and asked it to find all the other land that looks like theirs. Countries that grow few grapes, or grow them mainly for eating, were not counted as evidence that their land is unsuitable. They were simply scored.
Does it work?
Before trusting the map we tested it. We hid whole continents from the model and asked it to find their vineyards anyway. Shown nothing from Africa, it still picked out South Africa's wine country from the farmland around it nine times out of ten. The usual rule of thumb, which looks only at summer temperatures, did worse than a coin toss. Of 26 famous wine and grape districts, from Bordeaux and Napa to Cappadocia in Turkey and Qazvin in Iran, the model recognised 23. It rejected the Sahara, Siberia and the Iowa corn belt.
What marks out vineyard land, it turns out, is mostly warmth: enough heat through the summer, winters that are cold but not bitter, plenty of sun and little frost in spring. Soil matters less than wine-lovers might expect, at least at this scale.
The idle acres
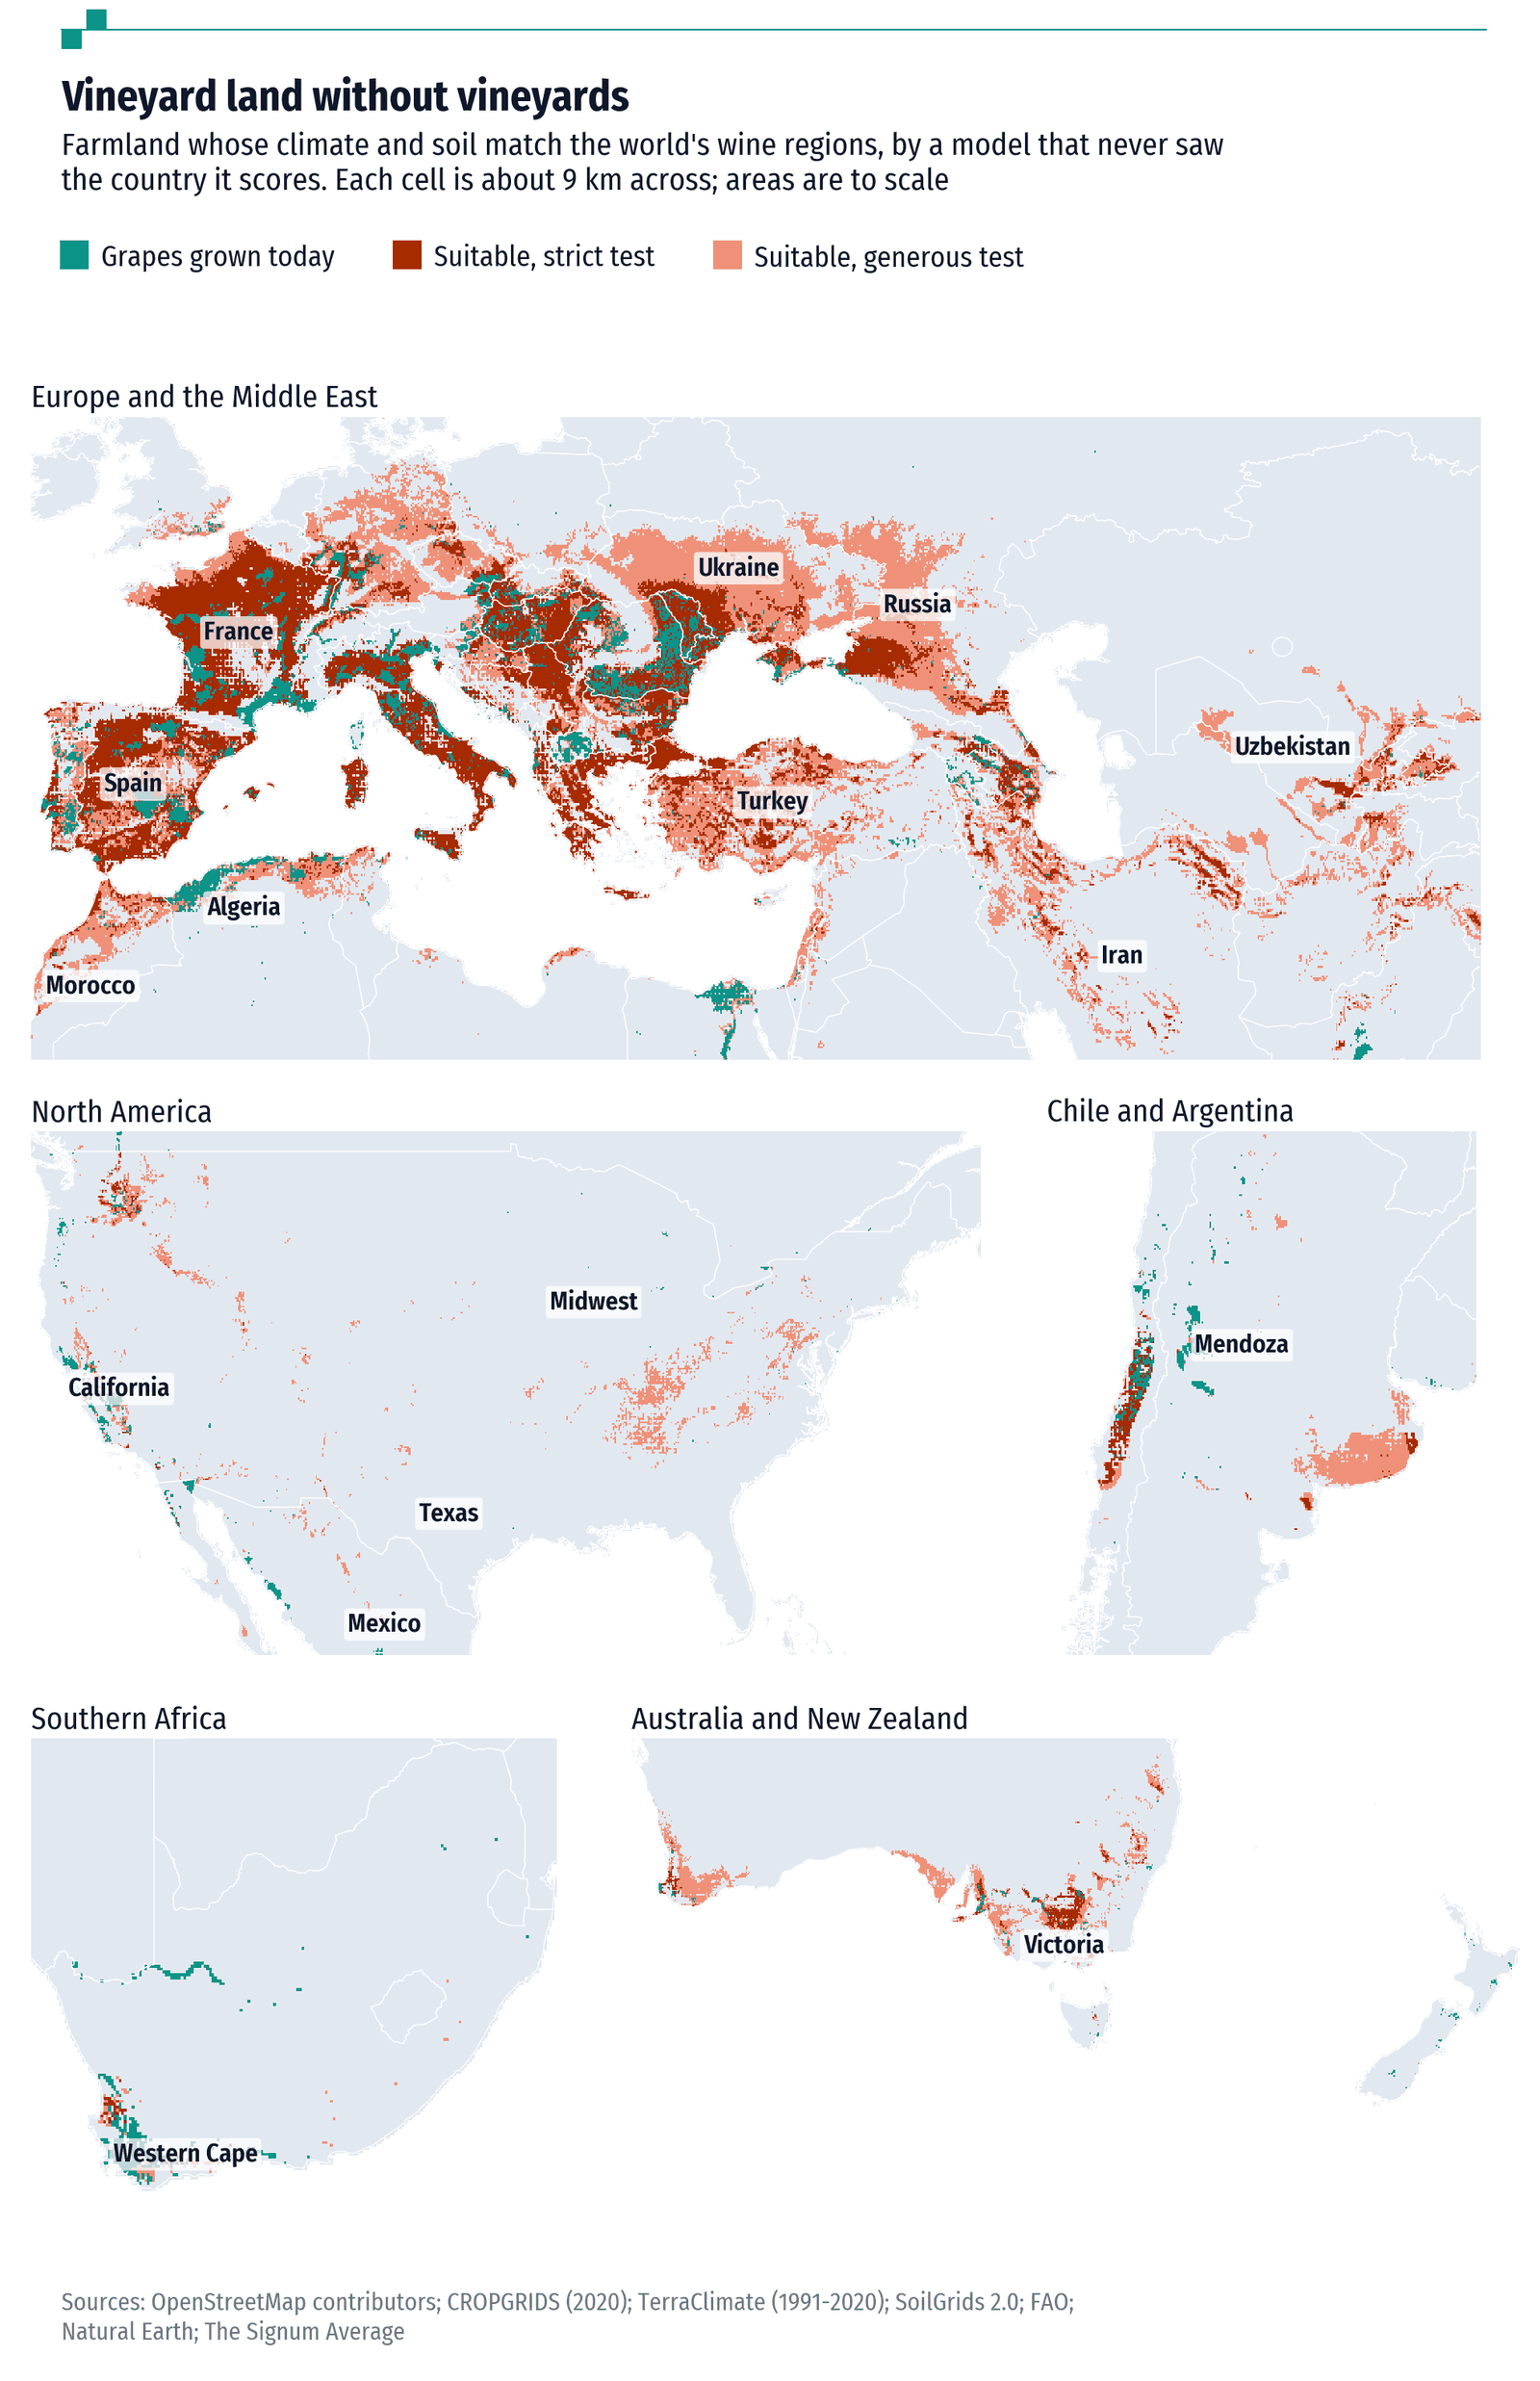
The first finding is that land fit for vines is plentiful. Farmland that is not already under vines, but is as good as the land that holds three-quarters of today's vineyards, covers 70m hectares; we call this the strict test. Count land as good as the weaker vineyards too, the generous test, and it is 159m. The world grows wine grapes on just 4.5m hectares. Most of that land, quite rightly, grows other things.
A few countries stand out. Eighteen of them hold 30% of the world's best vine-ready farmland but only 3% of its wine grapes. Turkey has the most: 4.5m hectares by the strict test and 12.3m by the generous one. It grows grapes on about 400,000 hectares, mostly for eating and for raisins, but wine grapes on only 14,000. Southern Russia, around Krasnodar and Stavropol, Ukraine and Serbia come next. Iran grows grapes on 174,000 hectares and has 1.8m hectares of land that passes the strict test, most of it in the north-west, around Ardebil, Tabriz, Zanjan and Qazvin, and in Khorasan. Algeria and Morocco have been pulling vines up: between 2000 and 2023 Algeria's wine grapes fell from 30,200 hectares to 2,300, and Morocco's from 49,600 to 6,700.
One caution: the evidence is thinnest exactly here. Too few vineyards in Turkey, Iran and Central Asia are on the map to test the model there, so its verdict on them rests on their climates looking like those of proven wine regions.
Elsewhere wine is spreading. England's vineyards grew almost fivefold between 2000 and 2023, and New Zealand's quadrupled. Our map, built on the average climate of 1991-2020, is cautious about Sussex; a warming world may be moving faster than any 30-year average.
Would the wine be any good? The land cannot say. We compared 21m ratings that drinkers gave to wines from 694 regions with the climate and soil of those regions. Climate and soil explained almost none of the difference between good regions and mediocre ones. Much of what makes a great wine lies in the slope, the site and the winemaker, things too small or too human for a map like this to see. So the map shows where vines would grow, not where great wine would.
A shrinking glass
Planting is the easy part. Selling is harder. The world drank 208m hectolitres of wine in 2025, according to the OIV, the industry's intergovernmental body. That is 14% less than in 2018, 17% less than at the peak in 2007, and less than in any year since at least 1961. China, France and America account for much of the fall. If the decline since 2018 continues, the world will drink 168m hectolitres in 2035.
If the 18 countries planted their suitable land as densely as a typical wine country does, they could make about 120m hectolitres a year, more than half of everything the world drinks. So land is not what holds wine back; thirst is. A fairer way to put a price on what these countries miss is to ask what share of the market they would have if it followed the land. If each sold a share of the world's wine equal to its share of the world's suitable farmland, the 18 would sell about 55m hectolitres more a year than they do. At the prices established producers get for their exports, that is worth about $16bn a year. If the market keeps shrinking and the wine sells cheaply, it is closer to $8bn; on the most generous reading of the land, $27bn.
Turkey misses out on the most, about $3.6bn a year, followed by Ukraine ($2.7bn), Russia ($2.6bn), and Serbia and Iran ($1.5bn each). We redid the sums in 15 different ways; the total ranged from $13bn to $24bn, and Turkey and Ukraine were always among the five biggest losers. This would not be new money for the world, though. In a market that shrinks every year, every bottle a newcomer sells is one an old producer does not. And most of it would be cheap wine: new regions rarely start at premium prices.
Why the land lies idle is a different question from whether it could grow vines. In some places the answer is law and faith, in others war or sanctions, and in some it may be that nobody has tried. The map shows where the vines could go. It cannot say who would drink the wine.
This article was revised on October 4th 2026 after a review of the analysis, which corrected the estimates of suitable land (from 115m to 70m hectares) and of lost sales (from $17bn to $16bn a year). The full report, with every test and the methods in detail, is available on request.
Data and methods
The grid
All land between 60°S and 72°N on a 5 arc-minute grid (about 9 km at the equator; 2.1m cells). Climate: TerraClimate monthly normals for 1991-2020, averaged from 1/24 degree. From them we compute the growing-season average temperature (April-October, October-April in the south), Winkler degree-days, the Huglin index with its day-length coefficient, night temperature in the ripening month, the coldest month's mean and night temperature, the hottest month's day temperature, the summer-winter and day-night swings, April night temperature (frost at budburst), rain over the year, the growing season, the two months before harvest and the winter, sunshine reaching the ground, the aridity index (rain over potential evaporation) and the growing-season water deficit. Soil at 15-30cm (SoilGrids 2.0): pH, clay, sand, organic carbon, nitrogen, stones and cation-exchange capacity. Irrigation: FAO's Global Map of Irrigation Areas (v5, about 2005), used only where the aridity index is below 0.65; elsewhere irrigation marks intensive farming of any crop and made maize land look like vineyard land. Cropland: the physical area of all 173 crops in CROPGRIDS (2020), capped at the cell's area.
Where vineyards are
Vineyards come from OpenStreetMap (landuse=vineyard), read from Overture Maps' release of September 23rd 2026: 872,520 mapped vineyards covering 3.46m hectares, their areas computed on the ellipsoid and summed by cell. For South Africa this gives 119,887 hectares against 119,471 from a direct OpenStreetMap download. A country's vineyards are taken from OpenStreetMap if it maps at least 35% of the country's grape area (version 1 required half; Spain, Italy and Moldova, at 38-45%, now qualify), because the models compare mapped vineyards with the land around them and do not need every vineyard; otherwise from CROPGRIDS if less than a fifth of its grapes there come from the coarse year-2000 census map, which misplaces vineyards (it shows none at Stellenbosch or Marlborough); otherwise the country is not used for training. A cell counts as vineyard if at least 0.5% of its land is under vines.
The model
Trained on the 29 countries where at least half of the grape area is for wine (Anderson, Nelgen and Puga, 2023 wine-grape area against CROPGRIDS grapes), with at least 1,000 hectares of wine grapes and a trustworthy vineyard map: 9,073 vineyard cells. Countries that grow grapes mainly for the table or raisins, or hardly at all, are never used as evidence against a place; they are only scored. Two models are fitted on all vineyard cells and a random sample of other cells: gradient-boosted trees (scikit-learn HistGradientBoostingClassifier: 300 trees, learning rate 0.06, 31 leaves, L2 penalty 1, balanced classes; 400,000 other cells) and a classic species-distribution model (logistic regression on the standardised measures and their squares; 200,000 other cells). The score is the average of the two models' percentile ranks, itself expressed as a percentile of all land. Each training country is scored by models fitted on the other countries (five folds grouped by country); every other country by the average of the five.
Tests. Hiding one continent at a time, the score separates that continent's vineyard cells from its other farmland (cells with at least 5% cropland) with an area under the ROC curve (AUC) of 0.83 in Europe, 0.89 in North America, 0.95 in South America, 0.82 in Oceania and 0.92 in Africa, against 0.73, 0.56, 0.75, 0.75 and 0.39 for a textbook rule (distance of growing-season temperature from 17°C, the middle of the 13-21°C range over which wine grapes ripen in Jones, 2006). On all land, which adds easy cases such as deserts and forests, the AUCs are 0.96, 0.95, 0.93, 0.93 and 0.88 (rule: 0.94, 0.87, 0.75, 0.93 and 0.57). Neither component model wins everywhere: the trees do better in Oceania and Africa, the species-distribution model in the Americas, which is why they are averaged. Across all training countries, scored out of country, the AUC is 0.97 on all land and 0.91 on farmland (rule: 0.91 and 0.72). Asia cannot be tested this way: only 69 vineyard cells, all in Armenia, had a trustworthy map.
Within single countries the test is harder, because climate varies less. On farmland, mapped vineyards outscore the country's other farmland with a median AUC of 0.75 in the training countries and 0.72 in others with at least 25 mapped vineyard cells (Ukraine 0.90, Serbia 0.74, Algeria 0.73, Georgia 0.72). Turkey is the exception at 0.39: 25 of its 46 mapped vineyard cells are in hot Mardin and Batman (growing-season temperature above 23°C), which the model, like the textbook band, rates below the rest; its mapped vineyards elsewhere score 0.96-0.997. Province-level census figures cannot serve as a test for Turkey, Iran or Spain, because CROPGRIDS spreads their national grape area almost evenly across provinces.
Of 26 well-known wine or grape regions looked up by name, 23 pass at least the generous test somewhere within 25km (18 the strict test, including Thrace, Cappadocia, Urmia, Qazvin and La Mancha); Marlborough, Willamette and Nashik pass neither. All six control places (the Sahara, the Amazon, Siberia, Kansas, Iowa, Guangdong) fail both. Scrambling one factor at a time, the largest losses of accuracy come from the summer-winter temperature swing, the Huglin and Winkler heat sums, growing-season temperature, sunshine and April night temperature. Soil matters little at this resolution.
Strict and generous tests
The strict test is passed by land scoring at least as high as the vineyards that hold three-quarters of today's vine hectares in the training countries (score 0.981, a percentile of all land); the generous test by land scoring as high as those holding nine-tenths (0.951). They cover 3.0% and 6.5% of the training countries' land. Suitable farmland is the cropland in cells that pass and are at least 5% cropland, minus the vines already there (OpenStreetMap vineyards or CROPGRIDS grapes, whichever is larger). Worldwide this is 70m hectares on the strict test and 159m on the generous one, against 4.5m hectares of wine grapes in 2023. Version 1 counted all cropland in passing cells, vines included, against what this note said; correcting it is most of the fall from 115m hectares.
Quality
Ratings: X-Wines, 21m consumer ratings (one to five stars, 2012-2021) of 100,646 wines. A region's score is the sum over its ratings of (rating minus the average for that wine type), divided by the number of ratings plus 300, so that sparse regions are pulled to zero. Regions with at least 300 ratings were located with OpenStreetMap's Nominatim geocoder within their country (923 of 1,204); the 694 with mapped vines within their outline are used. A region's climate and soil are averages over grid squares within its outline (at least 0.25 and at most 1 degree from its centre), weighted by vine hectares. Gradient-boosted regression trees (200 trees, 8 leaves, at least 20 regions a leaf), weighted by the log of ratings, were tested in eight folds grouped by country against the average region, and in eight random folds against the country's average. R² against the naive guess: -0.05 out of country (rank correlation 0.14) and +0.06 within countries (0.30). Ridge regression and the 423 regions with at least 2,000 ratings give R² between -0.07 and +0.06. Because no version beats the naive guess by a useful margin, the quality model is not used to rank land.
Market share and sales forgone
Benchmarks are 20 established wine countries in 2018-22 (Anderson and Pinilla): wine grapes cover 4.9% and 10.9% of their strict-test farmland (lower quartile and median); yields are 35, 57 and 79 hectolitres a hectare; export prices US$1.85, 2.84 and 3.64 a litre (quartiles). The 18 countries that plant less than the lower quartile, with at least 100,000 hectares of strict-test farmland, hold 30% of the world's strict-test farmland but 3% of its wine grapes. Planted like the median wine country, their land could make about 120m hectolitres a year, more than half of what the world drinks, so capacity is not the constraint. We therefore value what each would sell if its share of the world market equalled its share of suitable farmland, minus what it has now. Low case: strict-test land, the market in 2035 if the 2018-25 decline continues (2.1% a year, to 168m hectolitres) and the lower-quartile price. Central: strict-test land, the 2025 market (208m hectolitres) and the median price. High: the larger of the strict and generous land shares, the 2025 market and the median price. Totals: 45, 55 and 96m hectolitres a year, worth US$8.2bn, 15.7bn and 27.4bn at export prices. This is a benchmark for land left unused, not a forecast: law, religion, capital, skills and reputation decide where wine is made, and new producers would have to take sales from established ones.
Robustness
Fifteen versions change one choice each: the strict-test cut-off (70% or 80% of vines), the farmland threshold (2% or 10% cropland), the vine threshold (0.25% or 1%), the version 1 training set (OpenStreetMap bar of 50%), equal weight for each continent, no soil, irrigation everywhere or nowhere, each model alone, and smaller trees with a faster learning rate and a new seed. Accuracy on farmland, out of country: 0.88-0.91. Strict-test farmland: 58m-102m hectares. Sales forgone, central case: $13bn-24bn a year. Rank correlation of countries' strict-test farmland with the main version: 0.76-1.00. Turkey and Ukraine are in the five largest losers in all 15 versions, Russia in 14 and Iran in 12.
Main sources
OpenStreetMap contributors via Overture Maps (ODbL); CROPGRIDS v1.08 (Tang et al., 2024); TerraClimate (Abatzoglou et al., 2018); SoilGrids 2.0 (Poggio et al., 2021); FAO Global Map of Irrigation Areas v5 (Siebert et al., 2013); Natural Earth; K. Anderson, S. Nelgen and G. Puga, Database of Regional, National and Global Winegrape Bearing Areas by Variety, 2000 to 2023 (University of Adelaide, 2025); K. Anderson and V. Pinilla, Annual Database of Global Wine Markets, 1835 to 2024 (University of Adelaide, 2025); OIV, State of the World Wine Sector in 2025 (2026); X-Wines (Azambuja, Morais and Filipe, 2023).
The data behind every chart can be downloaded from the data on GitHub, free to reuse with credit.
Cite this work
Our articles and data visualisations rely on work from many sources. When citing this article, please also cite the underlying data sources, listed in Data and methods.
Signum Average (2026) - "Where the wine isn't" Published online at signumaverage.com. Retrieved from: https://signumaverage.com/articles/undiscovered-wine/ [Online resource]
@article{signumaverage-2026-10-02-undiscovered-wine,
    author = {{Signum Average}},
    title = {Where the wine isn't},
    journal = {Signum Average},
    year = {2026},
    month = {oct},
    url = {https://signumaverage.com/articles/undiscovered-wine/},
    note = {Online resource}
}
Reuse this work freely
Text, charts and data on this page are published under the CC BY 4.0 licence: you may copy, adapt and republish them for any purpose, as long as you credit Signum Average. Third-party data keeps its original licence.